This a technical followup to the preliminary acoustic map, with updates on the signal analysis and calibration. No event candidates are presented in this update.
The first autocorrelation matching maps did not take advantage of beamforming techniques to minimize noise and interference, and match at a single brief snapshot in time. They are dependent on good wavespeed and hydrophone placement accuracy, but without a way to gauge either one.
The maps now presented use an algorithm and visualization method that covers a specific time frame and is not only tolerant of calibration errors, but can reveal both wavespeed and bearing errors.
The first step was to separate the triad sources by color channel to reveal beamforming quality and detections by bearing. The red channel was chosen to show H08 coherence between the triad hydrophones, and green corresponding to H01. The blue channel represents the nondirectional signal intensity for both sources. Similar to the previous map, multiple analysis frames are computed into a stack, but stepping through time rather than window size.
The first “DotSeparate” algorithm plots revealed that hydrophone placements used by the CTBTO are somewhat inaccurate. The plots show the H08 interference sources, but coming from three different bearings, differing by several degrees. This is apparently caused by the least squares method used for determining the best estimate of a combined triad bearing based on time differences but corrupted by noise. With three hydrophones, each pair can provide a bearing with ambiguity on the quadrant, and they should all generally agree if the placement is correct. The previous placement calibrations methods apparently only utilized the combined least squares result, quite properly putting less emphasis on pairs that didn’t agree.
Unfortunately that approach results in many possible calibrations. If two pairs are equally off-calibration in opposite directions, they sum to approximately the right direction, but only for one bearing. This results in a wide range of errors that will vary depending on the bearing of interest.
An attempt was made to calibrate the hydrophone placement using a downhill simplex linear optimization method that iteratively adjusts the constrained placement parameters for a minimum error result. In this case, it was best agreement on local wavespeed, which should be a short term constant. The inputs were known arrival delays on strong signals from various bearings, from cross correlation peaks with a wide window. This is generally good to within one time sample.
The results would vary wildly using the same LMS algorithm for detection of bearings. The solution was to regenerate the predicted arrival delays from the current placement variables, and minimize errors against the reference signals.
This produced much more consistent results with the pairs in precise agreement for most bearings. Beyond just calibrating the hydrophones against each other for best result, incorporating the known location of an interfering seismic survey ship allowed rotating the H08 array about 1 degree into good absolute calibration.
Attempts were made to use two NOAA seismic events on Mar 8th for bearing calibration. The distant M5.4 quake SE of Africa was useful for zeroing the H01 array, but another M4.4 quake near Jakarta gave improbable wave speeds. (The seismic event appears displaced from the acoustic source by about 100 km.) A wider range of calibration input data could significantly improve the CTBTO accuracy with this method, possibly even on a weekly or daily basis rather than using static values.
Here are the current calibrations for Mar 8, 2014 (revised since Nov 3, 2016):
% H08S
% Calibrated using nonlinear optimization method, plus the approximate bearing 112.6 of a known survey noise source
% This linear optimization method aligns each triad pair, rather than just the combined bearing.
wavespeed = 1.489166635;   % profiled from ODV WOA09_March data for H08 location
lat = [ -7.645472924   -7.645279724  -7.627520091  ];  % calibrated 10 events and 2 bearings using Simplex AlignFunction
lon = [ 72.4743714     72.49345218   72.4838806    ];  % 2016Dec07 aligned w/ wavespeed - Ed Anderson

% H01W
wavespeed = 1.48139;   % profiled from ODV WOA09_March data for H01 location by Ed Anderson - 370location.org
lat = [ -34.89290841  -34.89862111  -34.88306192 ];  % new alignment of each pair 2016Dec27
lon = [ 114.1540886   114.1340395   114.1360134  ];  % rot to Bearing 217.9567 M5.4 quake SW of Africa
The resulting map after calibration reveals small disagreements in the bearings, especially near the hydrophones where local wavespeed is more critical, and hyperbolic parallax effects cause signals to fall out of beamforming based on bearing alone.
Using beamformed nulls to minimize interference, a snapshot for 7th Arc event time plus 22 seconds (00:20:00 UTC) shows relatively narrow beam discrimination:
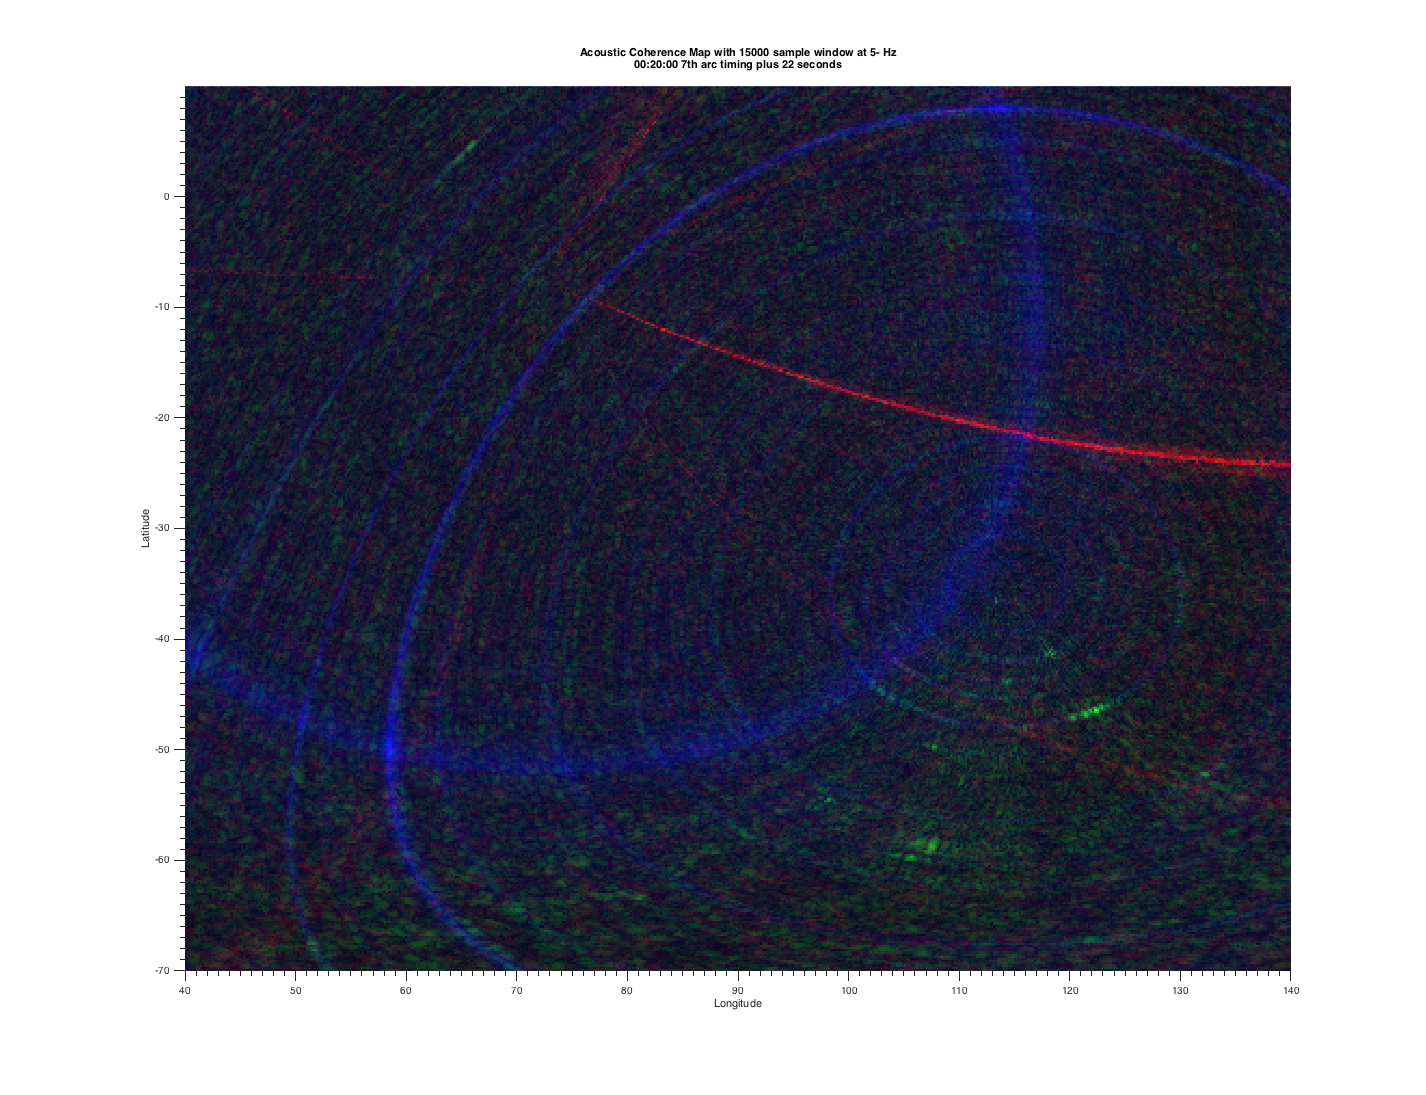
An exact event match for 7th arc timing with precise wavespeed and hydrophone locations should produce a yellow/white dot on the map, but no strong signals are seen. Ice events arriving at H01 as green show good beam alignment. The H08 red arrivals show a continuous stream of sounding events coming from a survey ship at bearing 112.6 near Exmouth. Three strong aliases of the boomer also stand out. Another seismic survey at bearing 35 also has an alias at 160 degrees. It is apparent that other signals can be detected down to the noise threshold, despite the strong interference.
For error tolerance in the impact event timing and arrival matching, multiple timing snapshots can be combined into a single map. The map is on an orthographic projection preferred for Google Earth overlay. The 36 frame sequence can be inspected as a high resolution .avi movie file: AcousticMap-DotSeparate-timescan-3min.avi
A plot of three minutes surrounding the 7th arc timing at 5 second spacing is cluttered, but has some notable features:

With good calibration and accurate wavespeed profiles, a signal event exactly at 7th Arc impact timing would show a symmetrical X with yellow pixels where the red and green segments cross. A signal before or after 00:19:37 would change the crossing point but remain symmetrical, with later events moving toward the hydrophones. Errors in bearings or wavespeeds would cause an asymmetry, and signals would arrive at different times.
Events slightly beyond the three minute time range can be extrapolated from where a red/green signal pair would intersect. Most all of the green ice events do not match at the northerly locations because they are from a much earlier event time. Very strong ice events also have aliases in a band around the hydrophones, and the near hemispherical range of the map allows these to be discerned from actual event matches.
This map gives a high confidence for the calibration and wavespeed profiles. Waviness is caused by variations in the underlying fitted polynomial surface accuracy, mainly due to sparse wavespeed data points. This can be improved by precalculation of geoid distances and wavespeeds as a future refinement.
To reduce the clutter, the timeframe can be shortened to one minute following 7th Arc timing:

Use the matching .kmz map overlay file for reference.
The time frame starts at 19:37 in this plot and segments are 1 minute long. An impact at +30 seconds would now have a centered cross. An impact at +0 along the 7th arc would have an L shape, and at +1 minute would be a chevron. This can still be extrapolated beyond the timeframe as if the segments continued.
The discrimination near the great circle path between the hydrophones is better than with the earlier “DotAuto”, but the the crosses are severely flattened. A match exactly on the line between the hydrophones would be a yellow bar.
While this visualization method and map confirms that there are no strong event signals coming from the 7th arc search zone, it also demonstrates that beamforming methods allow weaker signals to be discriminated and matched with tolerance to errors. The new hydrophone calibration method has improved the beamforming results and bearing alignments, which will benefit future oceanographic studies and event detection using the CTBTO triad arrays.
Note: These two acoustic bearing maps presented on Nov 7 have been revised to correct calculation errors and incorporate improved calibrations. The earlier autocorrelation map is unaffected.