As the underwater sonar search is being suspended, progress continues here on refinement of the acoustic analysis algorithms. The nulling method for rejecting known noise sources has been greatly improved. More proper numerical treatment of the input data has eliminated some high frequency sampling artifacts, allowing use of the full signal bandwidth. Changes to the visualization methods better display weak signals and help differentiate events from noise.
Matching events visually
Key to finding candidate impact or implosion events is identifying the location of other signal sources. Unless the origin time of an acoustic event is known, the distance is uncertain along the bearing of arrival. Finding matching event arrivals at each hydrophone array gives very good accuracy for both the location and time of an event.
Using the previously presented technique of reverse mapping signals from a given time window onto a cartographic overlay, a sequential map over time can be generated frame by frame. This is a slow computation with the current code setup, taking about a day of processing on an Intel Core i7 computer to generate a low resolution time scan using the 11 hours of data available at each array.
H01 array signal arrivals mapped 1 min/frame at 5 FPS. Available in 3MB .webm or 9MB .mp4 or 19MB .mp4 video file formats.
H08 array signal arrivals mapped 1 min/frame at 5 FPS. Available in 3MB .webm or 13MB .mp4 or 54MB .mp4 video file formats.
These maps cover most of the Indian Ocean from N10 E40 to S70 E 140, which includes the hydrophone arrays and surrounding coastlines. The broad area is useful for identifying the transit limits and alias bearings.

The improved beam nulling is apparent where previously interference would dominate the map masking weaker signals. The better hydrophone location calibration now allows fitting multiple noise sources into narrow beam nulls.
Note that the .webm animations above are highly compressed, compounding the already low image resolution. For visual matching, a more accurate rendition interleaves the two sequences into the same spatial map by alternating frames. Click to download the large animation file in 500MB QuickTime ProRes .mov format or 142MB .mp4 format. The sampling for each sequence is at one frame per minute starting at 00:01:00 UTC The alternating sequence interleave doubles the frame count, with the odd frame being the first of each time matched pair (H01 then H08). The time of a visually matched event is found in minutes by (OddFrameNumber – 1)/2) + 00:01 UTC on Mar 8, 2014. The closest frame pair to 7th Arc timing are frames 41 and 42 (at 00:20:00 UTC).
Exploring the acoustic map events
The map sequences reveal quite a bit of detail about events. The most obvious are the bright white specks of seismic and ice events. The matches on ice events are fairly close, showing that the wavespeed profiles and hydrophone calibration are reasonably accurate. The wavespeeds are sparsely profiled around the 7th Arc and near major events toward coastlines, then interpolated for each pixel.
When matches can’t be found, it is usually because the signal did not propagate well to one of the arrays. It is still unknown whether a surface impact in deep water would be conducted with sufficient strength down 1000m into the SOFAR Deep Sound Channel to be detected. There is ample evidence in these maps of seismic soundings near the sloping Australian continental shelf, and very strong ice floe events over deep water, but the SOFAR channel approaches the surface near Antarctica.
The seismic sounder noise source at bearing 35 from H08 Diego Garcia is barely detectable at H01, but it appears to originate from a ship near N11.6 E85.6 putting over deep water in the Bay of Bengal. Knowing the details of the array on that ship would be useful, but they are typically towed just below the surface. The repetitive signals are very strong at H08, even at a distance over 2500 km (and possibly diffracted around the coast of Sri Lanka), implying that a presumably stronger jetliner surface impact should conduct into the SOFAR channel over deep water.
All signals arriving from the north and NW of Cape Leeuwin are relatively weak at H01. It was previously presumed here that any subsurface terrain below the SOFAR channel depth should not impede the signal, but the depth near H01 is at least 1500 m before dropping off the plateau. The highest terrain beyond that to the NW rises only to a depth of 2500 m. It appears that terrain within 500 m of the SOFAR channel does attenuate the signal.
All of the USGS reported seismic events over magnitude 2.2 on that day with a direct path are detected. An M4.4 quake off Java (S6.0 E102.5) at 08:50:55 UTC is strongly detected at H08. It is only weakly detected at H01, with spatial spreading of the signal. What might be considered an anomaly is a very similar but far stronger H08 signal from a 01:16:00 Java event that is not in the USGS quake list:
Despite being much stronger than the nearby M4.4 at H08, it is only barely detectable at H01. It does have some characteristics of a seismic event, with mostly low frequency components lasting a few seconds. The difference in amplitude might be due to shallower water near the anomalous event if it is a quake. It is notable that the strong 1:16 event is within 40km of the 7th Arc where it intersects the Java coast, but 56 minutes later than the last ping. (The 1:16 event map image can be imported into Google Earth as an overlay for comparison).
[ 2018 Update: After more accurate location of the Java Anomaly, the reason for the very weak arrival at H01 became apparent. The SOFAR direct path is partially blocked by shallower 600m water near the continental shelf of Australia. ]
It is interesting that the acoustic locations of the quakes are up to 250 km off from the locations reported by the worldwide seismic network. This is likely caused by the quake signal conducting about five times faster through the earth’s crust before transitioning to hydroacoustic rates. The quakes being at various depths would cause that conversion point to vary.
Back to 2014
Another anomaly is the signal reported in 2014 by Curtin University, tentatively classified as seismic and completely incompatible with any of the satellite BTO ping ring calculations. Assuming an 00:19:37 event time, the H01 arrival from bearing 300.8 alone places it at a location of about N4.8 E65.6 west of the Maldives. The IMOS Scott Reef signal event passing through the Maldives is more complex. The bearing from H08 to that location is blocked by Diego Garcia and Chagos Bank, but the path to H01 is relatively clear. There are no reported quakes along that bearing for H01, and historical quakes are further west by 350-500KM near the Carlsberg Ridge fault. A detailed investigation of that event using autocorrelation methods and IMOS recorders is on hold, awaiting new data from French hydrophones in operation around Ile Amsterdam at the time. The signal could have come from as far as the coast of Oman.
Late Arrivals
The original premise of this project was to search for late implosion signals since no obvious impact signals have been detected near the 7th arc. Looking through the frame sequences for arrivals at H01 only from the southwest toward north excludes the very frequent ice events. Most false alias signals of ice events and waves breaking over the array can be identified by color in the maps.
The three hydrophones can be paired three ways. Each of the pairs can get a bearing, but for any one pair the signal arrival timing could have come from an event on either side of their alignment. Each pair is assigned to Red, Green, and Blue color channels. When the pairs perfectly sum, the signal color would be white. The further off-color, the worse the match. The three alias bearings appear as pure colors and are easily discounted, but not all colored pixels are incorrect. When any of the pairs is in end-fire alignment toward a signal, no accurate bearing can be resolved, and the result is a spreading of that color channel. Those three smeared color axes are fixed on the map for each hydrophone array, and the color symmetry around the endfire bearings can be taken into account.
By excluding ice event signal matches and their signal aliases, remaining late arrivals from the 7th Arc direction could be an implosion event. While the signal examination continues, there are two relatively strong and clear event candidates on H01. Neither is matched with an H08 arrival.
H01 bearing 261.57 candidate
The first detection is from H01 bearing 260.9 at 09:55:54 toward southern Madagascar. A 7th Arc intercept would give location S35.73 E91.92 at 09:33:15 UTC. The ocean bottom near the presumably accurate 7th Arc at this spot has been carefully examined with towed sonar, but a later impact would shift the expected location along the bearing toward H01.

There is a relatively strong 00:19:37 H08 event detection at S36 E95 about 12 km off the H01 search bearing, within the range of error. Another clear 00:19:37 H08 event at S36.55 E91.66 is only 50 km from the 7th Arc, and about 90 km from the H01 bearing.

There is also a weak H01 arrival with 7th Arc timing from the same bearing:

H01 Bearing 238.75 candidate
Another H01 signal from bearing 238.78 appears to be a double event, with arrivals at 06:37:42 and 06:38:09 UTC.
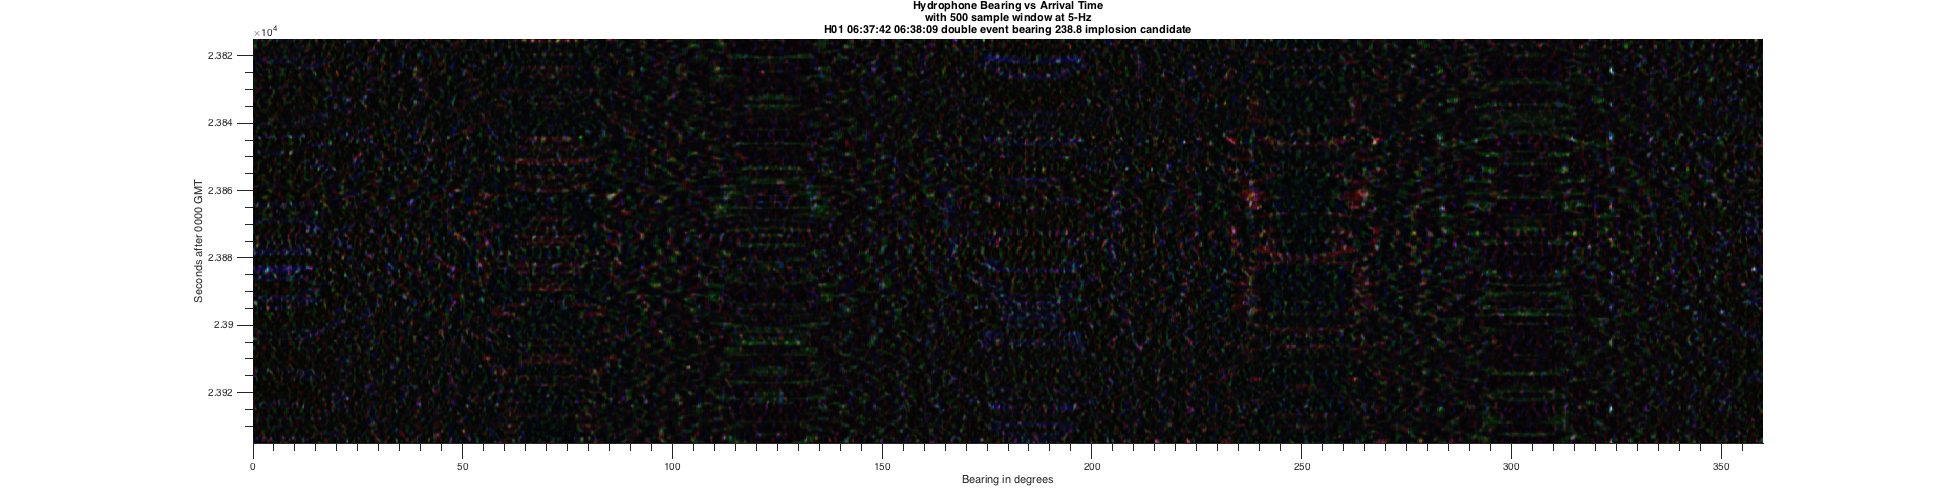
The source bearing misses just south of the 7th Arc ping ring with a far endpoint at the East Cape of Africa. What’s interesting about this signal is that it coincides with a possibly confounded 00:19:37 H01 event location on the same bearing 540 km SE of the 7th arc.

Nulling out the stronger ice event at bearing 148.75 leaves its red alias, but also a weak signal at bearing 239.1 degrees.

This is near where multiple satellites detected several large pieces of debris in a large area around S43-45 E87-92 in mid-March, 2014.

Chinese scientists estimated a reverse drift origin at S43.5 E85.3 that is about twice as far as this candidate from the suspected debris. An organized aerial search did not confirm the debris sightings, but it covered an area further east of the satellite spottings based on continued drift. There are matching H08 signals for a 19:37 event near this spot but about 20 and 90 seconds early. This could be due to an incorrect H08 wavespeed estimate over the propagation path.

Further Musings
The strongest signal on the recordings was earlier detailed here as the H01 04:59:20 S55.6 E90.65 late implosion candidate. It was since classified by ATSB as impossibly far south, and thus likely an ice event. It still stands out as uncharacteristic of southern ice events. The events along the Antarctic coast tend to have a clearly defined signal, and a rise in frequency, regardless of strength. That character has been detailed in scientific papers with an accuracy allowing ranging with a single hydrophone by variations in the dispersion. The events clustered NE of a large breaking ice floe in deep water near S58.5 E 88.5 have a broader spectral spread (hiss) with an upsweep in frequency. The strong event is decidedly different. It has no prominent frequency shift, but strong narrowband spectral components. It is unique in having a long preamble that crescendos to a sharp impulse. Despite the strength of the signal, it does not correlate well at the three hydrophones on either array. Note that these “DotPairs” maps use an algorithm that compares signal phase only, mostly ignoring intensity. Most events have a detection intensity that matches their acoustic amplitude, but this very strong signal has relatively weak correlation. It implies that this event has multipath characteristics that differ with minor variations along the route. Without other known examples, this could be the characteristics of an implosion within the SOFAR channel. Detecting weaker events like this one could be difficult.
Reverse drift model investigations by others now indicate a more northern search focus. A flight path over Cocos Island (which has a runway) passes over the Batavia Sea Mount and intersects the 7th Arc at around latitude S28. This is important because Cocos Island has CTBTO infrasound station recordings that could provide sub-event-threshold details about the flight from atmospheric sound doppler shifts. A flight path to the 2015-2016 search region may have been too far from Cocos Island to detect, but would now be much more likely. Efforts here to obtain that data for analysis have been unsuccessful, due to the CTBTO only accepting data contracts with large institutions. The CTBTO has recently released Cocos I06 data on the public IRIS.EDU seismology network but only as far back as April 2, 2014, stopping three weeks short of the time requested. Access to CTBTO hydrophone data is similarly restricted, with H01 and H08 data only available from after Dec 2014.